Ebike Motor Power Curve Comparison Chart: BOSCH, Yamaha, Shimano, Brose

Is there an updated comparison from a reliable source, preferably explaining the procedure of testing. I saw Court using a newer chart in his latest bulls review.

Also is peak power sustainable for a long period of time or is it just available in bursts?
 
I am choosing between an active Line plus motor and a performance line plus motor and would like to know their start up behaviour. If I am at a set of traffic lights on a hill which will be easier to start with? Do they output power at zero or near zero rpm?
 
I have made the motor Graphs of the Bosch Active line 3, see here:
Bosch Active Line 3 mid-drive motor tear down

Normally, the duty cycle of a PWM motor control is 0% for 0V and 100% for 36V. However, at the Bosch Active Line 3, the maximum duty cycle is 19V/36V = 53%. We can also say that the internal motor is a 19V motor.
If anyone has any comments about then let me know.
Just few people cycle with a cadence of 100 rpm on an electric bicycle, therefore a graph is also made at 16V, which corresponds to a cadence of 80 rpm:

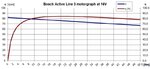
Bosch Active Line motor graph at 16V
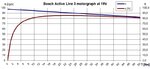
Bosch Active Line power motor curve at 16V
It is not clear why Bosch uses a 19V instead of 36V motor. This reduces the efficiency of the motor controller because the maximum current is greater and therefore the losses in the Mosfets as well.
 

Attachments

  • Bosch-Active-Line-motorgraph.jpg
    Bosch-Active-Line-motorgraph.jpg
    82.5 KB · Views: 1,634
  • Bosch-Active-Line-motorgraph-19V.jpg
    Bosch-Active-Line-motorgraph-19V.jpg
    80.4 KB · Views: 1,047
Back