Thanks for the update. Do you have any photos of the display? I don't think there are many reviews of the unit yet.
How's the backlight?
Did anyone try the bluetooth hack to make the wheel size smaller to override the speed limit?
I went out today to trial Smart Control which is meant to get rid of range anxiety. You can either set a distance to ride or a time for your ride. The app then computes the motor power your battery can afford to give for you to achieve that range or timed ride. My battery was 100% and I set the ride time for 3hrs 30 mins. It commpted a power level of 30%. As the motor max power is 250 watts I assume this meant assist of of about 80 watts in top of my efforts.
The good thing was the battery lasted the 31/2 hrs with power to spare. The bad thing is that the Smart Control over rides the usual power settings. You can toggle power off and then back the Smart Control but can't as far as I can see over ride Smart Control without going into the app i.e. from the controller or display buttons and employ say Turbo power for a steep hill. So a good work out and a good idea but it really needs tweaking to be of better use in the real world of leisure cycling that includes hills.
Here are some shots of the display as requested.
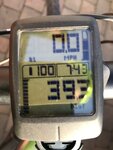
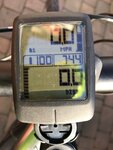
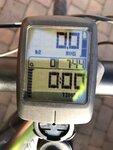
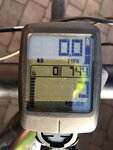
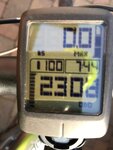
All screens have power level infographic as vertical bar at top right. Three blocks to denote Eco, Sport or Turbo. Current display is Sport with two of three blocks highlighted. Lower left of each screen is the battery charge status. Actually 10 small blocks which go out as you use the battery. Each small block denotes 10% charge.
First photo speed in mph upper large figure and lower large figure distance (39.3) miles. bad across centre show actual percentage battery charge (100%) and time of day. The large figures are customisable as is the left hand box of the central band.
Second photo same screen but distance zeroed for new ride
Third photo screen two. Upper large figure average speed ro this trip and lower time elapsed for this trip. Left hand centre bar was showing cadence (zero as I was stationary).
Fourth photo screen three. upper large figure speed and lower large figure rider current power input
Fifth photo screen four. Upper large figure max speed this ride and lower large figure odometer (total distance rider since last reset)
I also have a screen that shows speed and calories burned.
Hope this is helpful. As you can see loads of information.
Also the Mission Control app logs your ride on a map and uploads to Strava.
 . Both bike were bought in november 2018 and at that time they were still announced as compatible with Mission Control App. I live i Denmark and there might be a difference in the time Specialized stopped promoting Mission Control App. I asked the LBS to change the front sprocket to 48T, but I have to wait till next service because of delayed postage. Now I have to explore all the new features in the TCD-W display
  . By the way, where is San Juans Islands?


