Buckle up, Specialized nerds!
Went back to my linear model based on official pre-SL documentation. Here are 3 screen shots of the interactive graphical version at

www.desmos.com
Here's the setup. Px = 300W is the SL's max mechanical motor power at 80 rpm cadence. B = 2.3 is the boost factor originally published for the SL 2's motor.
We're writing a Spec assist mode like my ECO (35/45) as E/M. As a motor property, B should be a constant, independent of both E and M.
This model's "linear" in that motor power Pm is directly proportional to E, B, and rider power Pr
below saturation and proportional to both Px and M but independent of Pr
above saturation. As indicated in pre-SL 2 documentation.
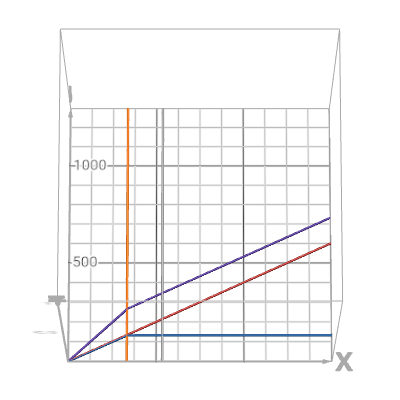
Here's a closer look at the model graph for E = M = 50. Pr plots on the horizontal axis and various kinds of power at the crank plot on the vertical axis.
Let's focus on the blue Pm plot and its pre-saturation ramp and post-saturation flat. Any realistic model of Specialized's power-sensing mid-drive PAS
must capture the following features:
o Since Specialized mid-drives have no throttles, the Pm ramp
must start at (0,0). Check.
o Since post-saturation Pm is fixed at the cap imposed my M, the post-saturation Pm plot must be a horizontal straight line. Check.
o Since I never feel a thing when I pedal my SL 1 through Prs, the ramp and flat
must meet at Prs. No jumps. Check.
o The orange vertical automatically marks the Prs (saturation Pr)
predicted by the model. It always falls at the ramp-flat intersection, just as it should. Check.
Discrepancies
In the E = M = 50 case, the model predicts Prs = 130W, as shown by the orange vertical above.
But something's wrong, cuz the Specialized Prs table for the SL 2's regular MicroTune gives Prs = 200W for E = M = 50 at 80 rpm. I used the graph's Pri slider to mark this official value with a gray vertical. Big discrepancy.
Now let's look at the model graph for the E = 50, M = 100 case:
Model says Prs = 261W (orange vertical), but the official Prs table for dynamic MicroTune says Prs = 385W (gray vertical). Even bigger discrepancy.
NB: To clean up the math ahead, we'll set E' = E / 100, and M' = M / 100. This makes E' and M' numbers between 0 and 1, inclusive.
How to fix the model?
So what's left to tweak to bring this model into agreement with the official SL 2 MicroTune tables above? If we keep the seemingly safe model assumption that the saturation motor power Pms = Px M', the only wiggle room left is in the shape or slope of the pre-saturation Pm ramp.
Can we win there somehow? Maybe.
Fix the ramp's shape?
You'll be relieved to know that we don't have the data needed to correct ramp shape by switching to a nonlinear relationship between Pm and Pr. Dead end.
Just fix the ramp's slope?
But we do have the data for a stab at a slope fix. If we keep the Pm ramp a straight line — i.e., keep Pm there strictly proportional to Pr — how could we fudge the slope to get official SL 2 Prs values out of the linear model?
In the existing model, the linear Pm ramp is given by
Pm = E' B Pr,
with slope S = E' B. Boost B is supposedly a motor constant baked into the SL 2, so no fudging opportunities there. Simply picking a different constant B value won't get the job done.
The only way forward would be to introduce a fudge factor F that's a nonlinear function of E, like so:
Pm = F(E) E' B Pr,
so the ramp slope becomes S = F(E) E' B
For the dynamic MicroTune table, this fudge factor F would vary with E as shown in the last column below:
EDIT: F values (column D) corrected Jan 27, 2026.
Since E only comes in multiples of 5, it'd be easy enough to interpolate the above into a complete E-based look-up table for code or spreadsheet use. A Desmos graphical model might also be possible.
But what about the regular (E = M) MicroTune Prs data?
This F(E) fudge factor has at least the right shape to work there, too. Stay tuned.
EDIT Jan 27, 2026: The F values above correct the Prs model for M = 100, but DO NOT correct the Prs model for E = M.


")