Ok. So rode about 32 miles today. I have a
Turbo Vado SL 5.0 with a Garmin Edge 840 latest firmware. I also was using a range extender. So started out with 150% battery on
specialized (100% on Garmin). I was riding almost 100% at 60/100 assist.
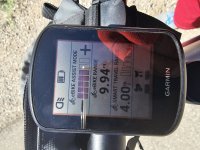
On my Garmin, shift advice wasn't working. Maybe it isn't compatible with the Vado. Travel Range on the Garmin is the same number that is being reported by Specialized as Estimated Range. Smart Range is something different.
When I started, Estimated Range was 52 miles. Smart Range was around 10 miles.
Garmin smart Range would change as soon as I moved from sport, eco, turbo. Estimated range changed intermittently. Not sure why or when. I tried seeing if it was mileage or time related or battery related, but none of those were consistent.
Smart Range seemed useless to me. Not sure where Garmin is pulling this number from or if it's configurable.
Estimated Range ended up at 17 when I finished my ride at 32 miles. This was with about 40% battery left. For the last 15 miles of my ride, it was pretty much keeping me at 49 miles total range. Not sure if that total range number was correct, but at least it was consistent.
I'm going to msg Garmin to find out what is going with Smart Range.
No, no reason to!


 Hovewer, there are only two significant hills in the province (Mt. Calvary and Czersk), and those were too far for my Mastermind e-bike demo rides. Besides, I could climb Mt. Calvary with my Vado SL, on rough cobblestones!
  10% grade and a short climb.
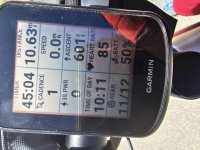


 One would be enough were I a healthy person...