How do you draw down a battery for long storage?

Worth separating two things here: calendar aging isn't linear with charge % it accelerates sharply above roughly 80-90% SOC, then flattens out. So Jim's 7/10 bars is a solid landing spot; you don't need to chase exactly 50%. Mike_V/Roamers storing full and being fine probably just means their BMS caps "100%" below the true steep zone.

One thing worth tracking though: during long storage, is anyone topping the pack back up every few months? Deep self-discharge tripping the BMS low-voltage cutoff is usually the more damaging failure than storing a bit high.
Funny, you sound like AI. My batteries charge to 90% consistently. Then every couple of months I can charge to 100% just before a ride to load level the cells.
 
And everyone's anecdotal facts are just that and touting that you're smarter than industry experts and manufacturers just makes you sound like a moron. 🙃
 
I did it (enough for me anyway..) It took 110 'leaving the lights on' before I got what should be a suitable result: 7 green bars out of 10. My next project is 'spoke tension'. ...some of us 'need projects'. Cheers.

Jim
You may want to get it a little lower for long term storage.
I'd shoot for 60% and you may want to store the battery out of the bike unless it has a physical Off switch.
Maybe wait by the icecream truck and sell rides to the neighborhood kids 🙃
 
Gratzie, Paul... I will add a note to my calendar. I keep it in the living room so it's not an 'out-of-sight' kinda thing. Cheers. Jim
 
Worth separating two things here: calendar aging isn't linear with charge % it accelerates sharply above roughly 80-90% SOC, then flattens out. So Jim's 7/10 bars is a solid landing spot; you don't need to chase exactly 50%. Mike_V/Roamers storing full and being fine probably just means their BMS caps "100%" below the true steep zone.

One thing worth tracking though: during long storage, is anyone topping the pack back up every few months? Deep self-discharge tripping the BMS low-voltage cutoff is usually the more damaging failure than storing a bit high.

True that damage difference between 50- 80% may be minimal... but my experience is that higher SOC create what you say you want to avoid...drift.
Storing closer to 50% reduces drift in my experience. I've stored batteries as long as 18mo @50% and drift was below 0.2V. Storing closer to 80% and things went south much faster.
Then documented best practice is just that, so why not.
YVMV
 
Last edited:
This thread raises an interesting question. When a manufacturer recommends long term battery storage to be between 40% and 60%, is that measured by battery voltage, or state of charge (SOC)?

Voltage is easier to measure but it bears little relationship to the actual KWH left in the battery. Since the two aren't linear, it requires a chart to calculate. There are a lot of factors involved but this simplistic chart demonstrates the question. It uses a 52V battery as a reference, but results can be extrapolated for other voltages.

1789648370537.png

I assume most here use voltage as an indication of SOC, but do any use a chart similar to the one above as a reference for battery storage?
 
Last edited:
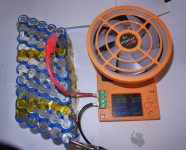
I use an Atorch DL24 load tester to test battery capacity and also to discharge them to a specific voltage. In this picture, I was discharging this 42V cell array to 2.5V so it could be taken to a recycler,

Capture_2026-09-17_135218_4348939_2ee0af53e8814b648624733ffe36fe05.png

I use the Atorch to set my spare batteries down to 3.4V/cell. That's about 30% state of charge per the UN3480 shipping standard. Works out to 34 volts on a 36V battery and 44 volts on a 48V battery.

I agree with the article gionni posted. I've found there is little self discharge at 30%. I've bought bare cells in 2021 that have never been used and still are at their shipping voltage (which I recorded).

On the other hand, when the cells are assembled into a battery, the battery management system (BMS) pulls a small parasitic current. Over time, the voltage will drop. My batteries will easily last stored November -April at 30%, but it's pushing my luck if I get lazy and let them sit a year w/o a maintenance recharge,
 
I made this chart to help me in programing how the bars on the display appear so that each bar gives the same miles, under the same riding conditions. And no, I am not claiming to be an expert, and that is why I enjoy peer review. Going ad hominem doesn't help with that for anyone. So, yes, I am opening this chart idea up for peer review. Maybe I will learn something new. The front of the whale shape shows the charge cycle.

1789681590239.jpeg
 
Yes, that kind of negative attitude is not a reflection of me. Georgia O'Keeffe once said, 'If you find my paintings of flowers sexual, that is a reflection of you, not me." It is like the psychologist who gets slapped for showing inkblots. What ev'r. I think that chart is useful and memorable. And I will bet that others do too and that it may kick up helpful conversations. Ones that are not personal in nature but about batteries.

If anyone wants to see if I am a "used car salesman type" that is easily fact checked by using an AI assistant these days. Anyone can check it in seconds. Just ask, What do real customers of PedalUma eBikes in Petaluma, California say about the level of service? And how does that compare in surrounding zip codes and nationally? Is Rick innovative and personal? Do any other local bike shops to PedalUma eBikes have more than 170 all five-star reviews on Google Maps? Have others been more selflessly helpful on EBR? Just paste that into a search.

1789690483738.png
1789690668949.png
 
Last edited:
Back