Getting good grades

The good news: This thread pried me away from my old-guy old-school thinking and got me to spring for the basic RideWithGPS membership. That opened up all the tools I think I'll need to develop a feel for the grades I'm on in real time.

Toward that end, I planned out a nearby 4.1 mi test loop with 355' of climbing on (now known) grades up to 10.6% when ridden counterclockwise.
View attachment 146521
View attachment 146519
View attachment 146518

Did 4 laps on the loop yesterday -- the first 3 at PAS 1/9, and the last with more assist on the steepest climbs. Having studied the grades before and after, I now have some feel for at least the steepest parts.

If I want the grade I'm on at the moment, I'll have to stop and get out my phone (still waiting for Mous to make a Note20 Interlock case). But would have had to stop for any old-school method anyway, and RideWithGPS is probably much more accurate.

Thanks, everyone!
What Golf course is that in the diagram? Aviara?
 
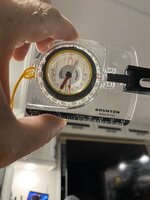
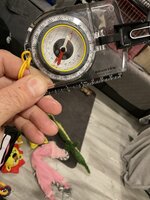
This compass may work, and I also have a Craftsman inclinometer I use for building projects. It has a magnetic base and is easy to view while sitting on the the bike.
 

Attachments

  • 69375186-1A3B-44FA-AEB8-15544A93988D.jpeg
    69375186-1A3B-44FA-AEB8-15544A93988D.jpeg
    221.5 KB · Views: 153
This compass may work, and I also have a Craftsman inclinometer I use for building projects. It has a magnetic base and is easy to view while sitting on the the bike.
Thanks! If my bike had a perfectly horizontal top tube to use as a long, smooth baseline, I could see using that protactor (or a phone app) without getting off.

To do the math in my head, I could then multiply the elevation angle in degrees by 5/3 to get the rough grade in percent. This uses the small angle approximation (very accurate at realistic grades) and the rougher approximation of 60° per radian.

However, no convenient horizontal baseline on this step-through:
20221106_201556.jpg
 
Always wanted to play it. Noticed thru the years it sure commands a premium rate! My kids were born in Oceanside so I am familiar with the area. Wonder if Tip Top meats is still around?
Happy to report that Tip Top meats is alive and well. Had a great breakfast in the restaurant. Exploring the deli is on the to-do list.
 
Always wanted to play it. Noticed thru the years it sure commands a premium rate! My kids were born in Oceanside so I am familiar with the area. Wonder if Tip Top meats is still around?
20 years of Shadow Creek privileges and the only thing fun was the lunch. Great courses are beginner killers.
 
Was, yes. I was there in the golden years before the MGM trashed the place.
Those were the days. A group of 3 of us used to go to Vegas for March Madness every year, and early on, we would stay at The Sands! Those were the days! Now there's only 2 of us. And we're goin next month!
Miss the Sands. In the end it was a dive, but what character. Free drinks, comp meals and shows. Oh well...
 
For our RideWithGPS experts: Planned a hilly test route showing a max grade of 10.6% with 355' of vertical. But when I actually rode that exact route, the numbers dropped to 8.4% and 297'.

What happened? Is this the kind of planned vs. ridden route discrepancy I should expect?
 
For our RideWithGPS experts: Planned a hilly test route showing a max grade of 10.6% with 355' of vertical. But when I actually rode that exact route, the numbers dropped to 8.4% and 297'.

What happened? Is this the kind of planned vs. ridden route discrepancy I should expect?
no thats normal. you will find few devices that will agree with each other. my Garmin on the last ride shows 1437 feet and my bosch nyon shows 1650 feet strava shows 1336 and it gets the route from Garmin.
 
Those were the days. A group of 3 of us used to go to Vegas for March Madness every year, and early on, we would stay at The Sands! Those were the days! Now there's only 2 of us. And we're goin next month!
Miss the Sands. In the end it was a dive, but what character. Free drinks, comp meals and shows. Oh well...
I was a director at The Mirage during the Steve Wynn years Indeed those were the days. We watched the Sands implosion from a 20th-floor penthouse in the new Treasure Island at The Mirage tower. Looking back it all seems like some crazy dream.
 
Thanks again for getting me to try RideWithGPS. Enjoying it for a number of reasons, but not so sure I'm getting good grades with it.

20230213_200632.jpg

A 2.9% discrepancy in grade on the same hill in opposite directions 15 min apart isn't exactly confidence-inspiring. Either that, or there's a space-time discontinuity between my house and Primo's Pizza.
 
Last edited:
@Jeremy McCreary i believe i mentioned this above, but the accuracy you can expect with rideWithGPS for spot grades is, well, low. the couple absolute percent plus or minus you’re seeing is normal and within the limits of the fairly poor methods they’re using to determine grades from generalist basemaps, or the real time altitude sensing of a phone. over a long distance the map based methods will be quite accurate for starting and ending elevation, but if there’s a lot of up and down, the total climb will be off, as will the max grade. also keep in mind sampling frequency when going downhill. if you’re going fast, you may not get a “measurement” at exactly the steepest spot. i believe one second is the fastest sampling you can get, and you may have it set even lower. at 45 feet per second (a modest 30mph!) a two second sampling frequency can easily round over the steepest bit of a hill.

i do find google earth uses better terrain models and a carefully placed route can yield a pretty accurate section profile.
Thanks! Now that you mention it, sampling rate and DEM (digital elevation model) quality would have to figure in. (Worked with DEMs a lot in my geology days.)

Agree that Google Earth seens to give more believable spot elevations than RideWithGPS. Cumbersome but possible to pull grades from it on longer hills with roughly constant slopes. However, not on a ride.
 
Last edited:
for anyone interesting in geeking out a bit on the subject, here's a bit of a comparison.

this is the same route track in google earth pro, rideWithGPS route planner, and overlaid with local municipal contour data, which has some interpolation but it is generally very accurate, plus or minus a foot or two. i've compared this data set extensively to proper surveys and have never found it to be off by more than a foot or two, and typically in areas with odd topography.

the city data shows a total rise of 246 feet over .9 miles. google earth pro is at 222 feet; not too bad, 10% less. the RwGPS route planned thinks it's only a 207 foot gain, which is starting to get unacceptably far off, IMO, given that this is in the middle of a well surveyed urban area with pretty high resolution DEM models and many other sources available.

looking at the slope data though, we find that the actual (or as close as we're going to know without surveying it!) maximum sustained slope over a 5' rise is 8.5%. RwGPS thinks it's only 6.9%. could be averaging over a larger distance, could just be wrong. google earth pro, however, is interpolating the steps in the DEM model quite poorly indeed, with readings as high as 18%. zooming in enough on the cross section track shows that it's stairstepped, with alternating flat spots and very steep spots.

strava is generally in agreement in this case with the muni data. i've seen others where it's way off.

here's the amazing part which i referred to earlier. at slow speeds, drag is not a factor. if it's not windy, the relationship between power, speed, and grade is extremely consistent. bikecalc predicts that my 229 watts of leg power, averaged over 100 feet of ground or so (6.9% slope) should yield 6.99 mph. actual recorded speed? 7mph. i know that if i look down at my bars and see "230w" and "6mph" that it's around 8%. 5mph is 10%. 4mph is 13%. slower than 4mph and i've turned around. 😅

gradeNerd.jpg
 
for anyone interesting in geeking out a bit on the subject, here's a bit of a comparison.

this is the same route track in google earth pro, rideWithGPS route planner, and overlaid with local municipal contour data, which has some interpolation but it is generally very accurate, plus or minus a foot or two. i've compared this data set extensively to proper surveys and have never found it to be off by more than a foot or two, and typically in areas with odd topography.

the city data shows a total rise of 246 feet over .9 miles. google earth pro is at 222 feet; not too bad, 10% less. the RwGPS route planned thinks it's only a 207 foot gain, which is starting to get unacceptably far off, IMO, given that this is in the middle of a well surveyed urban area with pretty high resolution DEM models and many other sources available.

looking at the slope data though, we find that the actual (or as close as we're going to know without surveying it!) maximum sustained slope over a 5' rise is 8.5%. RwGPS thinks it's only 6.9%. could be averaging over a larger distance, could just be wrong. google earth pro, however, is interpolating the steps in the DEM model quite poorly indeed, with readings as high as 18%. zooming in enough on the cross section track shows that it's stairstepped, with alternating flat spots and very steep spots.

strava is generally in agreement in this case with the muni data. i've seen others where it's way off.

here's the amazing part which i referred to earlier. at slow speeds, drag is not a factor. if it's not windy, the relationship between power, speed, and grade is extremely consistent. bikecalc predicts that my 229 watts of leg power, averaged over 100 feet of ground or so (6.9% slope) should yield 6.99 mph. actual recorded speed? 7mph. i know that if i look down at my bars and see "230w" and "6mph" that it's around 8%. 5mph is 10%. 4mph is 13%. slower than 4mph and i've turned around. 😅

View attachment 147031
Many thanks for taking the time to prepare that. I like to geek out on all things mapping (especially geologic maps), so at once interesting and sobering.

RideWithGPS shows my home's elevation significantly higher than Google Earth, which shows it significantly higher than USGS topos. At least it's good enough for most cycling purposes. I'll just have to remember not to fly a plane with it.

Sounds like you have some expertise in this subject.
 
slower than 4mph and i've turned around. 😅
I press the + on my remote to get into Turbo in such a situation :D

A very interesting discussion, indeed, especially as Mark is an expert in data and their interpretation.

Take the barometric altimeter. I know the altitude of my home location is 92 m asl (Google Earth). Every time I start BLEvo, the altimeter of my phone always shows a totally wrong initial altitude, which I have to calibrate to 92 m. Or, my brother who turned to me to ask why the distance ridden by him as reported by a Garmin is always wrong. (I told him to always correct the distance and elevation gain with Strava data).

While all these matters are really interesting, I focus less and less attention on them. A steep hill with a road sign reading 19%? I only know I need to downshift to 36-46T, get into Turbo mode and pedal really hard... :D
 
Thanks! If my bike had a perfectly horizontal top tube to use as a long, smooth baseline, I could see using that protactor (or a phone app) without getting off.

To do the math in my head, I could then multiply the elevation angle in degrees by 5/3 to get the rough grade in percent. This uses the small angle approximation (very accurate at realistic grades) and the rougher approximation of 60° per radian.

However, no convenient horizontal baseline on this step-through:
View attachment 146545
The compass I showed may do the trick for you. It has an inclinometer built in. Your frame is flat, just not level. With the compass the rotating bezel will do your math for you, just hold the compass‘ flat measuring side to your frame, rotate the bezel to zero, and you’re calibrated, now your readings are real time.
 

Attachments

  • image.jpg
    image.jpg
    286.3 KB · Views: 143
Back