Jeremy McCreary
Bought it anyway
- Region
- USA
- City
- Carlsbad, CA
Resistance to forward motion is an ever-present foe in cycling. In the spirit of know thine enemy, here's an interactive visualization of the 3 main power losses due to air, gravitational, and rolling resistance. It's made in the Desmos online graphing calculator.

 www.desmos.com
The visualizer lets you manipulate the key rider, bike, and external factors with 7 independent sliders. The effect on the power-speed profile shows on the graph in real time.
Great for visualizing what-ifs bearing on things like how best to spend your bike money, your battery range, or your own effort.
The interactive power-speed profile
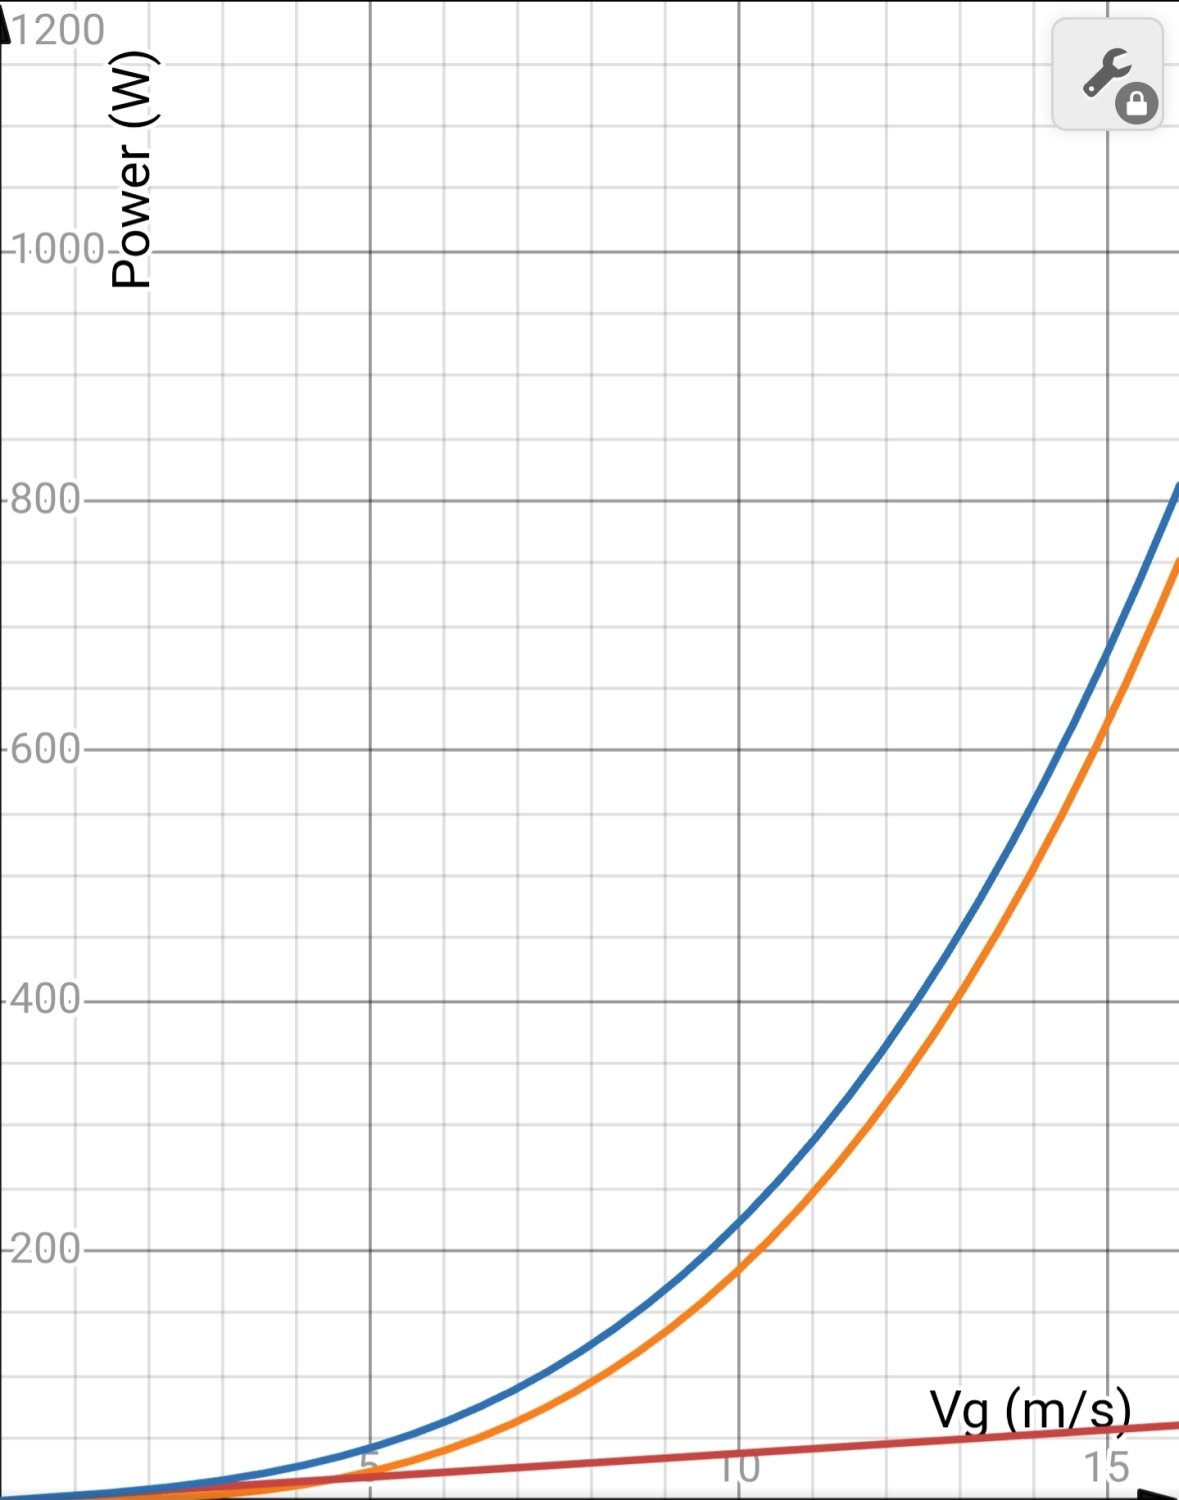
Power-speed profile for a typical TdF scenario.
The model graph plots ground speed Vg in m/s on the horizontal x-axis and the associated mechanical power loss in W on the vertical y-axis. The orange curve is the aerodynamic power loss Pa as a function of Vg. I think of this kind of plot a power-speed profile.
The red profile shows the weight-dependent power loss Pw due to gravity and rolling resistance combined. This profile rises as speed, system weight, and especially gradient increase.
The blue profile shows total power loss Pt = Pa + Pw. Blue is the mechanical power needed to hold speed Vg with the parameter sliders as you left them. The few watts of drivetrain losses are ignored.
Sliders and other stuff below the graph
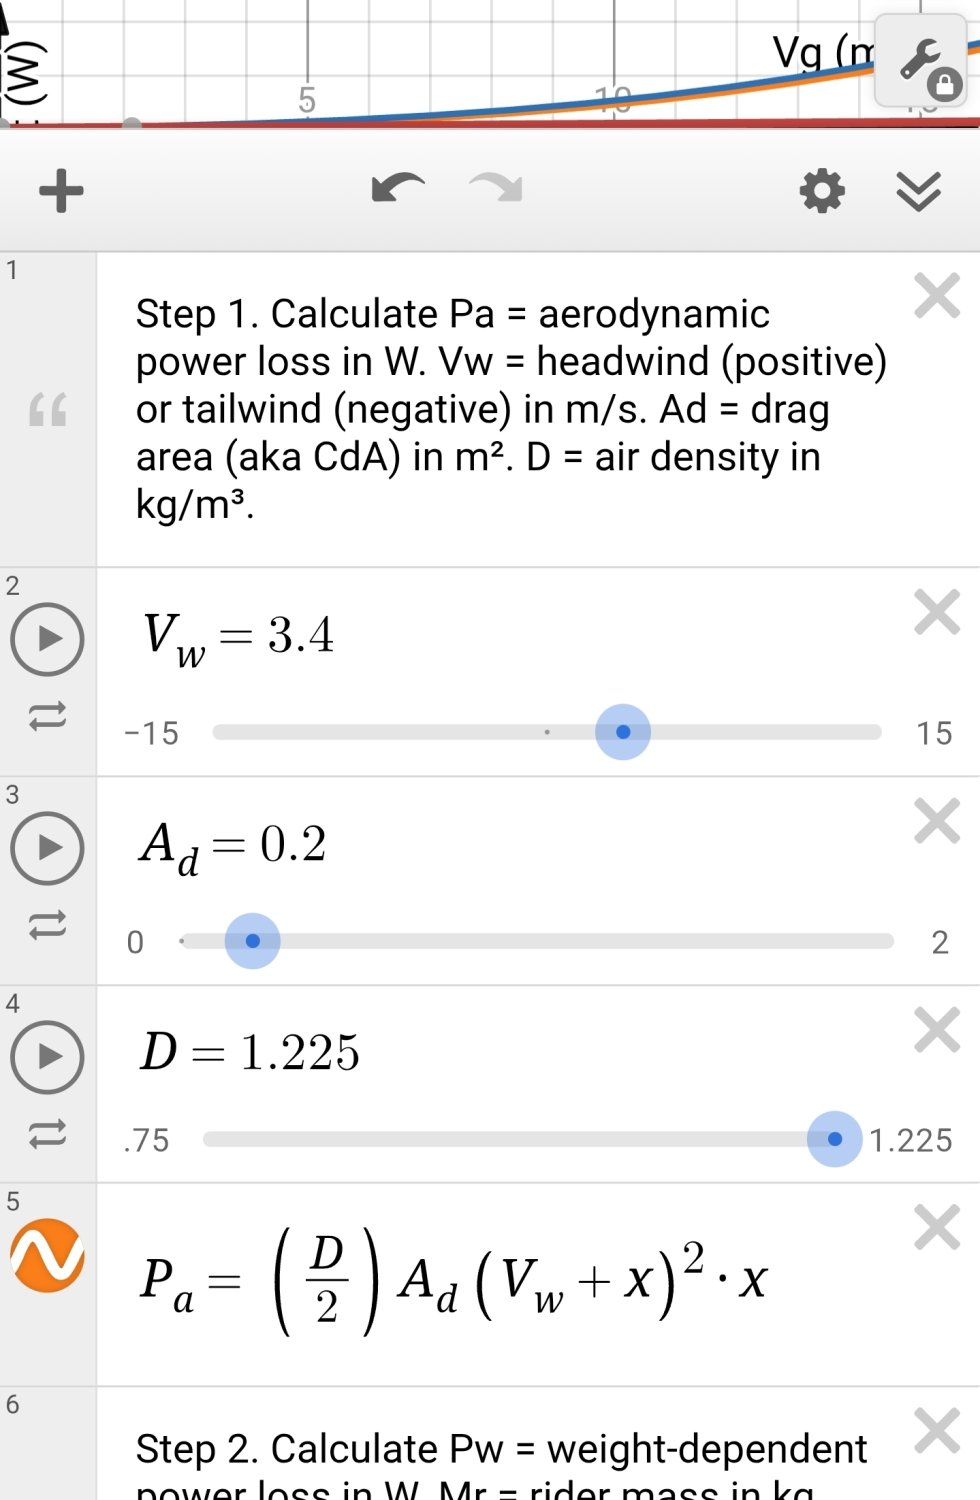
The headwind, drag area, and air density sliders determining air resistance.
Below the graph are text lines for symbol explanations and slider lines for playing around with key parameters like bike mass Mb and system drag area Ad. Don't worry, the sliders are the only things you need to pay attention to here.
The default slider settings describe a best-case Tour de France scenario on smooth, flat pavement in still air. These result in the power-speed profile above.
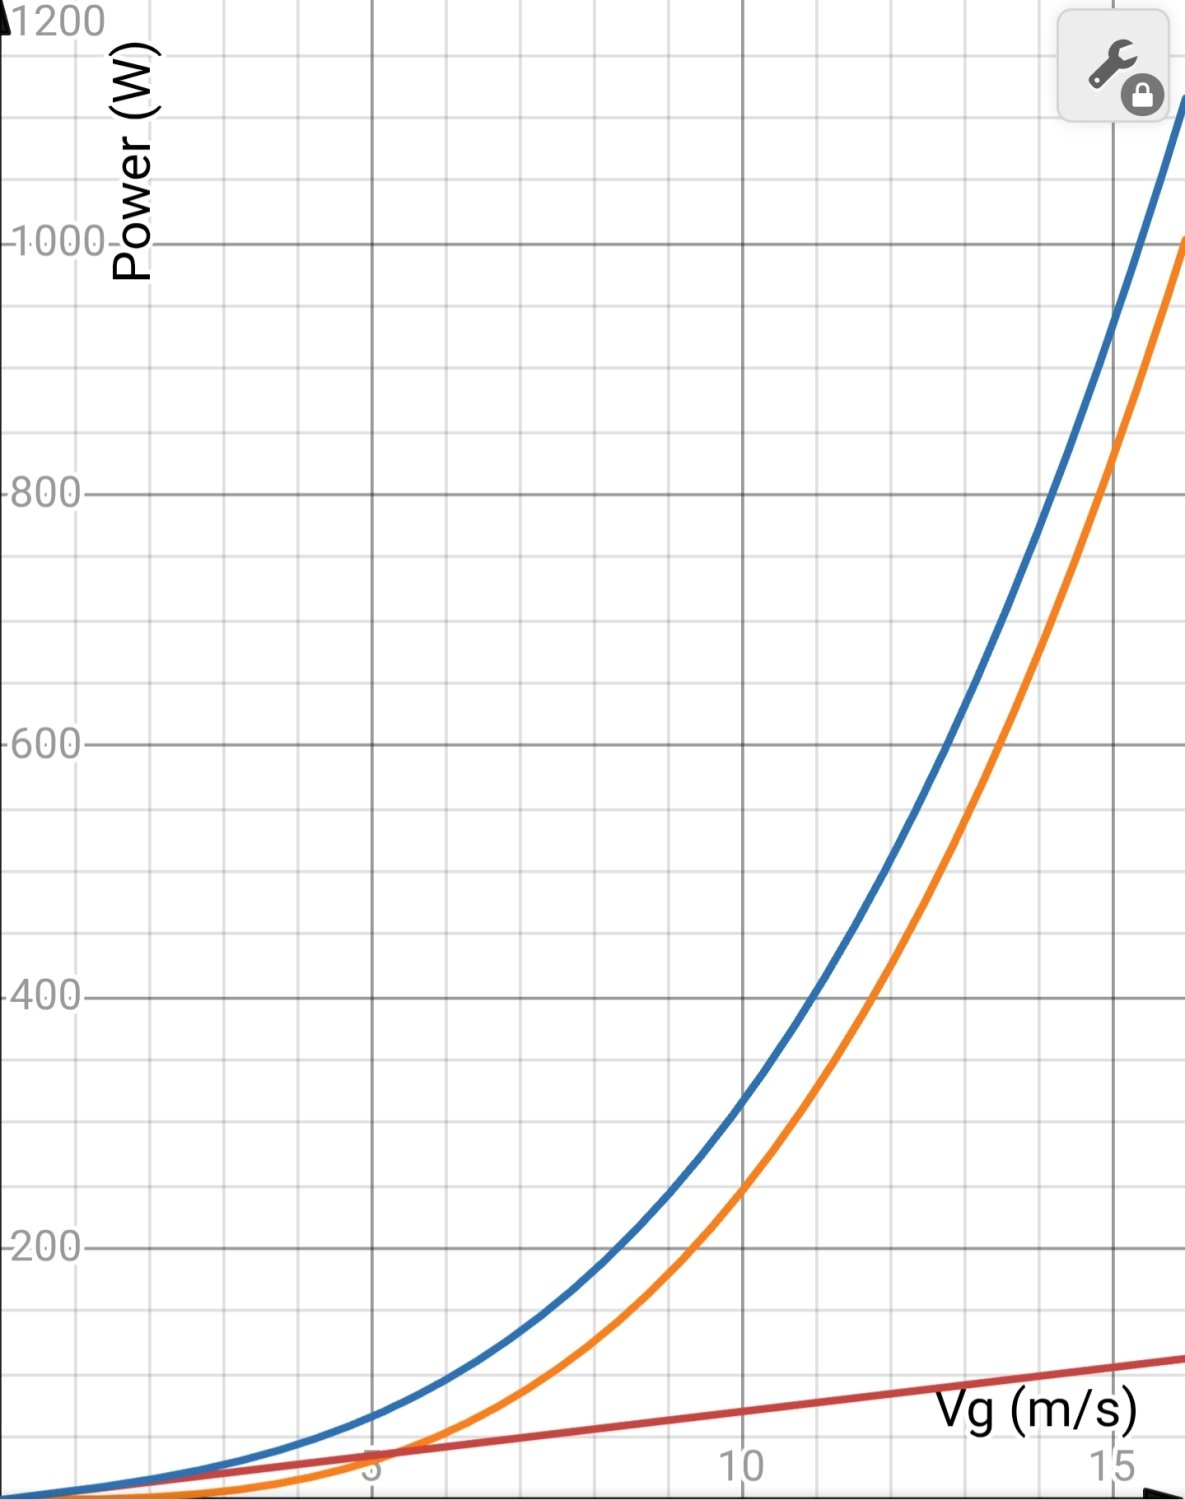
Power-speed profile with my own bike and rider parameters.
The sliders are there to be played with. My own bike and rider parameters produce a power-speed profile significantly taller and steeper than the TdF profile above. For example, on flat pavement in still air, it takes 225W to go 10 m/s (22 mph) in the TdF case and 320W in mine. About 80% of the 95W difference is aerodynamic.
Other lines set constants or do the actual math and graphing. Diddle with the sliders all you want, but messing with anything else will likely break your local copy of the model.
Applies to ebikes, too
The model's power-speed profiles apply to all bicycles. You just need to set the sliders appropriately.
A rider wishing to move at speed Vg without assist, with the sliders set as they are, will have to supply all of the corresponding Pt and a few watts more to offset drivetrain losses. With assist, the rider and motor will have to share that load somehow.
Playing what-ifs
The finished power-speed model's pretty easy to use. Many different practical and theoretical questions can be explored.
Remember, garbage slider settings in, garbage profiles out.
Also remember that on an ebike, Pt savings go to less effort or greater speed or battery range for the same effort.
Example: When does bike weight really matter?
Set the sliders for you, your bike, and a familiar flat ride with gradient G = 0. Then watch total power loss Pt (blue profile) as you play with bike mass Mb. Note how little Mb affects Pt on the flat. Now repeat with the gradient upped to a steep G = 0.1 (10%). Pt's much more sensitive to Mb now.
So, if you ride only on the flat, improving handling is the only real reason to spend $$$ lightening your bike. However, different story if you ride a lot of steep terrain.
Example: Crossover speed
The intersection of the orange and red curves shows the "crossover speed" at which the aerodynamic loss equals all other losses combined. It may be lower than you think.
Now watch how crossover speed changes as you vary the drag area Ad and bike mass Mb. How's your upgrade money best spent? Lowering Ad with more aero clothing or a less upright posture is generally much cheaper than shedding even 1 kg of bike mass.
power vs. speed
www.desmos.com
The visualizer lets you manipulate the key rider, bike, and external factors with 7 independent sliders. The effect on the power-speed profile shows on the graph in real time.
Great for visualizing what-ifs bearing on things like how best to spend your bike money, your battery range, or your own effort.
The interactive power-speed profile
Power-speed profile for a typical TdF scenario.
The model graph plots ground speed Vg in m/s on the horizontal x-axis and the associated mechanical power loss in W on the vertical y-axis. The orange curve is the aerodynamic power loss Pa as a function of Vg. I think of this kind of plot a power-speed profile.
The red profile shows the weight-dependent power loss Pw due to gravity and rolling resistance combined. This profile rises as speed, system weight, and especially gradient increase.
The blue profile shows total power loss Pt = Pa + Pw. Blue is the mechanical power needed to hold speed Vg with the parameter sliders as you left them. The few watts of drivetrain losses are ignored.
Sliders and other stuff below the graph
The headwind, drag area, and air density sliders determining air resistance.
Below the graph are text lines for symbol explanations and slider lines for playing around with key parameters like bike mass Mb and system drag area Ad. Don't worry, the sliders are the only things you need to pay attention to here.
The default slider settings describe a best-case Tour de France scenario on smooth, flat pavement in still air. These result in the power-speed profile above.
Power-speed profile with my own bike and rider parameters.
The sliders are there to be played with. My own bike and rider parameters produce a power-speed profile significantly taller and steeper than the TdF profile above. For example, on flat pavement in still air, it takes 225W to go 10 m/s (22 mph) in the TdF case and 320W in mine. About 80% of the 95W difference is aerodynamic.
Other lines set constants or do the actual math and graphing. Diddle with the sliders all you want, but messing with anything else will likely break your local copy of the model.
Applies to ebikes, too
The model's power-speed profiles apply to all bicycles. You just need to set the sliders appropriately.
A rider wishing to move at speed Vg without assist, with the sliders set as they are, will have to supply all of the corresponding Pt and a few watts more to offset drivetrain losses. With assist, the rider and motor will have to share that load somehow.
Playing what-ifs
The finished power-speed model's pretty easy to use. Many different practical and theoretical questions can be explored.
Remember, garbage slider settings in, garbage profiles out.
Also remember that on an ebike, Pt savings go to less effort or greater speed or battery range for the same effort.
Example: When does bike weight really matter?
Set the sliders for you, your bike, and a familiar flat ride with gradient G = 0. Then watch total power loss Pt (blue profile) as you play with bike mass Mb. Note how little Mb affects Pt on the flat. Now repeat with the gradient upped to a steep G = 0.1 (10%). Pt's much more sensitive to Mb now.
So, if you ride only on the flat, improving handling is the only real reason to spend $$$ lightening your bike. However, different story if you ride a lot of steep terrain.
Example: Crossover speed
The intersection of the orange and red curves shows the "crossover speed" at which the aerodynamic loss equals all other losses combined. It may be lower than you think.
Now watch how crossover speed changes as you vary the drag area Ad and bike mass Mb. How's your upgrade money best spent? Lowering Ad with more aero clothing or a less upright posture is generally much cheaper than shedding even 1 kg of bike mass.
Last edited:



 Me trying to compare my trek to my regular bike is hard enough. I dont know if the bosch power meter is something the same accuracy as my power meter crank arm. I know I have age a higher wattage on the e bike but A lower HR average and less tired. but my regular bike is slower so its a longer ride. I really need a power meter crank arm on the bosch to really see.




 's are warping the fields or sumthin??)
 ️ or kite ?), once I get as far NW as my debilitating Range Anxiety and my Complete Lack of interest in pedaling take precedence?

 ️
️ ️
️